
IT in the Lab: Using SQC to monitor analytical methods

By Jeff Cawley
Vice President, NWA
 Using statistical quality control (SQC) analysis to monitor analytical methods in the laboratory can help a manufacturer improve the reliability of reporting and identify the source of problems more quickly. Powerful and flexible specialized SQC software tools are now available that can play a significant role in reducing analytical method variation and, therefore, provide real process improvement, regardless of size of organization or industry sector.
Analytical variation in the laboratory can have a large impact on a manufacturer's bottom line. For example, when a manufacturer must certify that a batch meets specifications before it can be shipped to the customer or stored in tanks, accurate analysis for certification is critical. If an out-of-specification batch is actually certified as within specification, the manufacturer faces potential problems with customers, possibly even being removed from the qualified purchasing list. Yet, if the laboratory finds out-of-specification product, where is the problem? Is the lab wrong? Or, is there a problem in production? The more confidence the plant has in the lab's analysis, the quicker and easier the problem can be located and resolved. The more credible the lab analysis, the more confidence customers can place in the reports they receive.
Statistical Quality Control (SQC) with its control charts can be a powerful tool for monitoring analytical methods. The more reliable the analytical methods, the more people can trust them to provide valid results.
The key to increasing the reliability of results is to monitor the variation in the analytical methods themselves using a control chart. Variation in analytical methods is usually caused by process-related phenomena such as differences between technicians, instrument maintenance, or sampling techniques. Developing a control chart allows the analyst to determine the normal variation in a method. Then, if there is a problem with the method, the control chart can signal the analyst to investigate it. Additionally, control charts can help the analyst reduce the variability of the method itself.
Just how a control lab might use specialist SQC software to monitor the variation in one of its analytical methods is best illustrated by way of example:
Developing a control chart
A large, batch chemical manufacturer must provide a Certificate of Analysis (C of A) with each batch before the material is shipped to a customer or put into storage tanks for later shipment. The C of A shows that the batch meets the customer's specifications for the product.
The lab has five technicians to handle all the testing required for the facility. All technicians are cross-trained in all methods and any technician can be assigned to any particular batch.
In this example, the manufacturer must show that three variables meet specifications. These three are Phenol (not greater than 0.5%), Nonylphenol (not less than 95%) and Dinonylphenol (not greater than 4%). The lab uses a gas chromatograph (GC) to test each of these three variables.
The first step in developing the control chart is to choose a standard to test. In this example, the lab draws a 4-liter sample of chemical from production to be used as an in-house reference lot. This reference lot is selected because it represents the mid-range of the specifications the manufacturer must meet. Assuming normal usage, the lab expects this lot to last two years. The lab also calibrates its GC according to its in-house operating procedures and certifies it. After the reference lot is certified according to in-house operating procedures as meeting the specification for all three variables, a sample is drawn and diluted to the necessary 0.5 grams per liter for testing.
The next step in developing the control chart is to generate data using the standard under the lab's normal operating conditions. Since the lab can assign any technician to certify a batch, it is important to have all of the analysts contribute data to the development of the control chart. This will ensure that the lab accounts for the individual differences between technicians as part of the analytical process. As a result, the lab can test batches regardless of which technician is available. Workloads can be smoothed, new employees can more easily be brought into the lab, and vacations, sick leave, etc. do not influence the product-certification process.
Each of the five technicians tests the sample daily for eight consecutive days. Thus, the testing performed on this sample yields 40 data points on each of the three variables with the same GC. The data are stored in the LIMS for later SQC analysis.
The workhorse of SQC is the control chart, which graphically shows the extent to which various measurable characteristics (such as percentage of phenol) relevant to a process (in this case, the analytical process itself) are in control (meaning "in statistical control") or out of control (meaning "out of statistical control"). Each chart includes upper and lower "control limits," which are calculated to distinguish between in-control points (inside the limits) and out-of-control points (outside the limits). Note that in-control does not mean the sample is within specification. In-control simply means the process itself is predictable or stable.
A common control chart is the Individual and Range chart. This chart shows the central tendency of the process as the measurement on each sample (Individual) and the short-term variation of the process as the difference between successive measurements (Range).
As shown in Figure 1, the control chart obtained from this process includes the 40 data points. The use of specialized SQC software means that the lab personnel need not concern themselves with calculating the upper and lower control limits. Software such as ThermoLabSystems' Nautilus LIMS does this automatically, utilizing embedded NWA Quality Analyst components. The lab manager then examines the chart to determine whether it shows a process in-control or out-of-control.
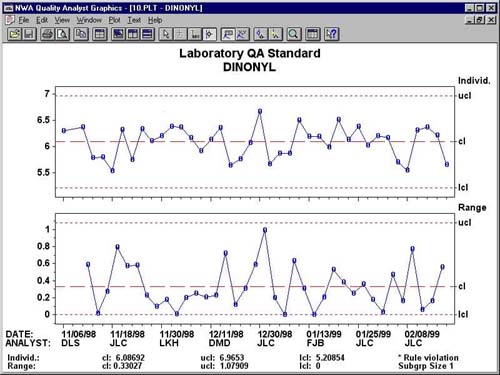
Individual/Range chart depicts a process that is in statistical control.
If the analytical process is not statistically predictable, the initial control charts will show data points falling above or below the upper and lower control limits (only 3 out of 1,000 are expected to fall outside of the limits due to chance.) When this is the case, the method is being influenced by external or "special" causes such as different sampling techniques, faulty calibration standards, or varying ambient temperatures. If the analytical method is not predictable, the lab manager investigates the external causes and ultimately corrects them.
In this particular case, there were no out-of-control points. The analytical method exhibited perfect control.
Since the 40 data points were found to be in control, the data can be used to set the control limits for the analytical method. Note that SQC in this case is being used to determine the variation in the testing results that can be obtained predictability. SQC is not being used to determine whether the process itself is producing acceptable results or whether any individual is producing acceptable results. SQC is simply showing what variability can be anticipated from the testing process on this sample and instrument.
Using the control chart
Now that the lab has accounted for the normal method variability, it must continue to monitor the method in order to determine if the method is providing predictable results. To accomplish this, the lab draws a sample from the control lot and tests it on the three variables using the same GC three times per week. If the results fall within the control limits on the control chart, the analytical process is stable. Therefore, there is no need to investigate the situation further nor is there a need to question the reliability of the GC.
If the results do not fall within the control limits, the method is not demonstrating predictability. The lab has established a Standard Operating Procedure (SOP) for investigating out-of-control situations. The first step is to check sample preparation. Therefore, the technician immediately draws another sample, dilutes it, and tests it. If the results still do not fall within the control limits on the control chart, the SOP calls for the technician to assume there is a problem with the GC.
Step by step, according to the SOP, the lab examines the GC to identify the problem. It might be the temperature sensors or a faulty detector. Once the problem is identified and fixed, a technician will prepare another sample and test it.
Improving test reliability
Assuming that the results from the thrice weekly samples continue to fall within the control limits on the control chart, the lab can test samples from production batches using the GC and feel confident that the results are defensible. As a result, if the lab analysis requires the GC and the testing shows a batch does meet specifications, a C of A can be issued. If the results indicate the production batch does not meet specifications, the lab takes another sample and if the results still indicate the batch is out-of-specification, the lab must assume the problem is in production.
Repeated testing of a production batch is not necessary. The lab can simply issue a C of A and feel confident that the batch meets specification or let production know that a problem has occurred in production with the batch. Turn-around time in the lab is reduced.
Furthermore, when the lab does issue a C of A, customers can depend on it. They know that the lab monitors its analytical methods carefully. If a result is obtained that could not be anticipated predictably, the lab has an SOP for investigating and correcting the problem with the analytical method. In fact, the reliability of its methods in this lab's case has been an instrumental factor in improving customer relations.
Using SQC to effect change
The most stringent and sophisticated SQC analysis won't do any good if the information gained isn't used to change the process. The real challenge of SQC arises in problem management, such as when the data clearly show that the test result falls outside the control limits. This is where specialized SQC software and the clarity of graphic communication can make a difference. With reliable calculations and good quality graphics, even a non-technical person can easily see the result is not within control limits.
Figure 2 provides an example of an out-of-control testing result. In this particular case, the lab technician could immediately see that there was a problem. Since a subsequent test showed a similar result, the lab knew the GC was not providing predictable results and needed to be fixed.
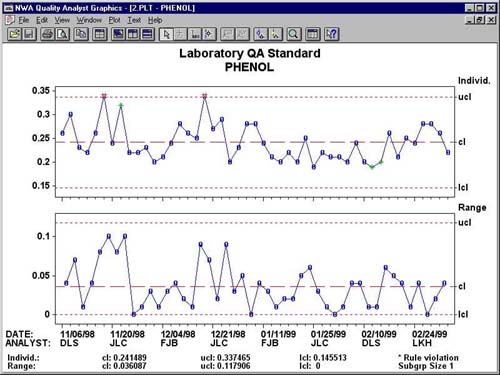
Individual/Range chart depicts a process that is out of statistical control.
The lab has also found an unexpected benefit from using SQC to analyze its methods—morale among the technicians has improved dramatically. Prior to using SQC to analyze its methods, production and the lab were constantly pointing fingers at each other. If the testing results showed the sample did not meet specifications, the production staff accused the lab of errors. The lab, on the other hand, often faced repeated testing to make sure it had not made an error. In the meantime, the batch waited. Now the lab can cite the reliability of its testing confidently; if the tests show the production batch does not meet specifications, the problem is in production. The lab technicians now know their work is reliable.
Production, on the other hand, knows that they have a problem. Already, they are closer to finding a solution and meeting the customer's order.
 About the Author:Jeff Cawley oversees corporate and professional organization relations and market development for NWA. He has lectured and written on applied SQC and the integration of the SQC function into larger scale information systems.
Before founding NWA in 1978, he was director of marketing for Alpkem Corporation, an analytical instrumentation firm where he created and directed the industrial marketing program and developed advanced analytical applications. Prior to his work at Alpkem, he was an account executive specializing in technology for the McWilliams-Church advertising agency.
He holds B.S. degrees in chemistry and geology from Juniata College in Huntington, Pennsylvania, and did graduate work in geochemistry at Princeton University. He is a member of the American Chemical Society, Association of Official Analytical Chemists, ASQ (American Society of Quality) and the Institute for Food Technology.