
Chromatographic pattern matching: A valuable new software tool

Waters Corporation
Contents:
Why compare chromatograms as patterns?
The retention time problem
Solving the retention time problem
Standard deviation as a measure of chromatographic pattern difference
Alignment examples
How the alignment algorithm compares a whole chromatogram
Application to a tryptic map
Implementation of the software
Why compare chromatograms as patterns?
When chromatographers examine a chromatogram, we first look for peaks. When we process a chromatogram, we use an algorithm to integrate peaks. Our mind and our mathematical tools are trained to parse chromatograms into peaks before we attempt further analysis. This makes sense if we want to either quantitate well-resolved components, or to isolate them as fractions: two of the three major applications for chromatography.
The third major application is comparison, where our goal is to determine if a sample mixture is the same as a standard mixture. Ordinarily, our standard mathematical tools first break a chromatogram into its constituent peaks. We would then compare the results of peak integration: areas, heights, and retention times. But accurate comparisons depend on accurately identifying peak baselines. This isn't a problem for a baseline-resolved peak with good signal-to-noise: determining the baseline is straightforward, and areas, heights, and retention times of peaks can be meaningfully compared.
However, if the mixtures are complex, the separation may contain fused peaks. Accurate determination of baseline for all components will be, at best, time consuming and, in practice, problematic. Rather than reveal genuine variations between corresponding components, measurements of peak height and area might only reveal variations in integration.
What do we do then, when a chromatogram is so complex that our traditional tools fail us? To compare complex separations, we then might have to resort to visual comparison, even at the cost of accepting results that are qualitative and subjective. Thus, the deceptively simple question -- "Is one chromatogram the same as another?" -- may be hard to answer.
The retention time problem
Rather than compare peak features, why not compare chromatograms as patterns? In the larger world of data analysis, point-by-point, or pattern, comparisons are commonplace. For example, spectral library searches typically compare data point-by-point.
But if we try to compare chromatograms as we would compare UV/Vis, IR, or mass spectra, we run up against chromatography's 'x-axis' problem. In spectroscopy or spectrometry, the horizontal, or x-axis, is a physical quantity – a wavelength, a frequency or a mass. Baseline correction and normalization can therefore be used to compare these spectra.
In chromatography, the x-axis is retention time, which is not an absolute quantity. Its run-to-run reproducibility is completely determined by the chromatographic system and depends on the solvent delivery system and the mobile and stationary phase chemistries. Thus, when we overlay two chromatograms, we typically find that each peak will appear shifted along the time axis with respect to its counterpart. We therefore cannot perform baseline correction and normalization to compare chromatograms as patterns.
Solving the retention time problem
Using newly developed software, (Millennium Chromatography Software version 3.2, released this past spring), we have implemented a fundamentally new technique to compare chromatograms. This technique treats a chromatogram as a pattern and compares it, within a specified retention time interval, to a reference chromatogram. An alignment algorithm based upon a five-parameter model of chromatographic variability, removes underlying chromatographic variation, of which retention time is the most obvious. A point-to-point comparison is then made between the aligned sample and reference within the retention time interval.
The model of normal chromatographic variation assumes variations in the following five properties of a separation: changes in baseline offset, in baseline drift rate, in concentration, in retention times, and in retention time scale.
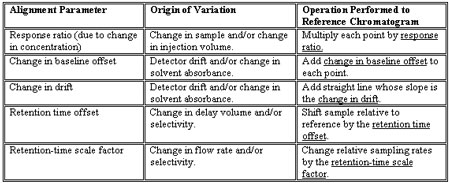
The pattern matching algorithm aligns two intervals using a two-step procedure by measuring these five alignment parameters using the raw data in the comparison interval and then using these parameters to align the chromatograms. The software then subtracts the data within the aligned intervals. Variations -- or lack thereof -- are revealed. The following table shows the five alignment parameters, the cause, or origin, of the variation and how that parameter is used to align the reference chromatogram to the sample chromatogram.
Origin of Variation Operation Performed to Reference Chromatogram
Response ratio (due to change in concentration) Change in sample and/or change in injection volume. Multiply each point by response ratio.
Change in baseline offset Detector drift and/or change in solvent absorbance. Add change in baseline offset to each point.
Change in drift Detector drift and/or change in solvent absorbance. Add straight line whose slope is the change in drift.
Retention time offset Change in delay volume and/or selectivity. Shift sample relative to reference by the retention time offset.
Retention-time scale factor Change in flow rate and/or selectivity. Change relative sampling rates by the retention-time scale factor.
Standard deviation as a measure of chromatographic pattern difference
Two values quantify the difference between chromatograms after alignment. The first value is the standard deviation, which directly measures the degree of misalignment. If the underlying mixtures are the same, the standard deviation will be comparable to the baseline noise. The other measure is the Percent Relative Standard Deviation or % RSD, which is the standard deviation normalized by, essentially, the peak height of the largest sample peak in the comparison interval, expressed as a percent.
Alignment examples
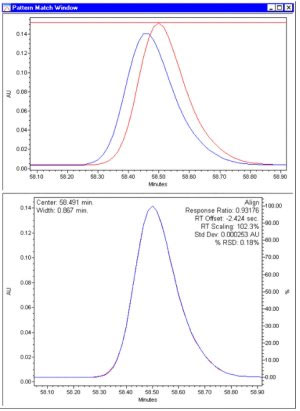
To illustrate how the pattern matching software works, the figure below shows the results of an alignment of a peak as seen in two replicate injections. The top pane displays an overlay of the unaligned peaks. The lower pane shows the overlay of the aligned peaks. The small, 0.18% RSD, confirms that the components are the same.
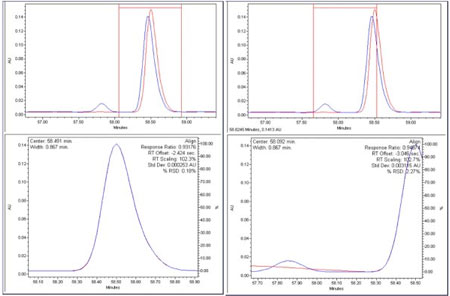
However, if new peaks are present, or if peaks are missing, the patterns will not align. In the figures below, the left window shows the alignment region centered on a single peak. The red vertical lines in the upper plots show the alignment interval. The lower plot shows the aligned data within the indicated alignment interval and the results of the alignment. The right window shows what happens if the algorithm attempts to align an interval containing a new peak at 57.8 minutes. When a new peak enters the alignment interval, the % RSD increases from 0.18% to 2.27%.
How the alignment algorithm compares a whole chromatogram
The Pattern Matching Software typically uses an alignment interval that is two peak widths wide. An interval of this width is long enough to meaningfully compare patterns to look for dissimilarities. It is also short enough that the retention time offset within that interval can be considered a constant.
When comparing entire chromatograms, the alignment algorithm compares chromatograms with a scan function. The scan is an automated procedure that centers an alignment interval of fixed width over every data point in the chromatogram. Thus the scan aligns the chromatogram and computes the standard deviation and % RSD for every data point.
Application to a tryptic map
A key application of chromatographic pattern matching is to establish an acceptance criterion for a sample and remove subjectivity from the decision-making process, without the need to integrate the peaks individually. The more complex the mixture, the more compelling the need to find an objective, automatic way to tell good from bad.
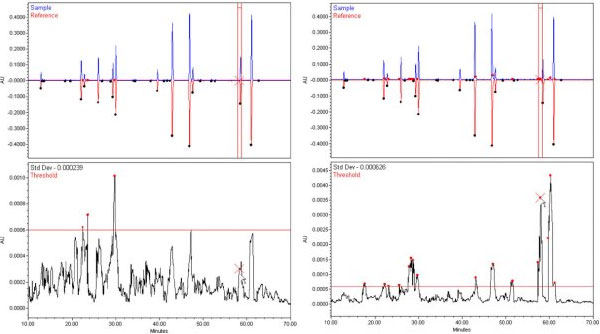
The top plots in the above figures show the mirror-overlay of two pairs of chromatograms. On the left are replicate injections of a tryptic digest of bovine cytochrome c. On the right is an overlay of one of these digests with another that was spiked with a chicken cytochrome c digest in a 95/5% ratio. To the naked eye, the chromatograms appear to represent the same composition.
The differences in the chromatograms are apparent when we look at the results as calculated by the Pattern Matching Software. The lower part of both figures plots the standard deviation of each alignment plotted versus retention time. The alignment interval used was two peak widths wide, about 26 seconds, and the red vertical lines in the upper right plot indicate one alignment interval.
A red, horizontal threshold line is drawn in both lower plots at the value 0.0006 AU. Note that on the left-hand plot of the replicates, only three points break just above this line. On the right hand plot containing the spiked sample, the Standard Deviations shows the locations of new peaks present in chicken cytochrome c in the regions where the standard deviation exceeds the threshold.
Implementation of the software
The alignment algorithm is the core of chromatographic pattern matching. The algorithm is implemented in the software example we have used, Millennium version 3.2, so that it can interactively align any interval of choice, or it can scan an entire chromatogram. The results of the scan appear in summary plots and, optionally, as tabulated results. The software can plot or tabulate the results from each individual alignment separately, or average results from a series of overlapping alignments.
The pattern matching option is fully supported in the Millennium version 3.2 software. Pattern Match analyses can be carried out in parallel with conventional peak integration. It can be applied to sample sets in batch mode or on individual chromatograms. Pattern Match report groups allow custom reporting of any or all results.
Chromatographic pattern matching provides a novel approach to the fundamental problem of chromatographic -- and mixture -- comparison.
About the authors
The authors hold technical positions at Waters Corp., Milford, MA. Steven A. Cohen, Ph.D., is Principal Research Scientist in the Biopharmaceutical Applications Laboratory; Marc V. Gorenstein, Ph.D., is Senior Scientist in the Core Technology Department; James R. Hendriksen is Principal Software Engineer.
For further information, contact Lauren Wood, Product Manager, Waters Corp., at 508-482-2956, or lauren_wood@waters.com.